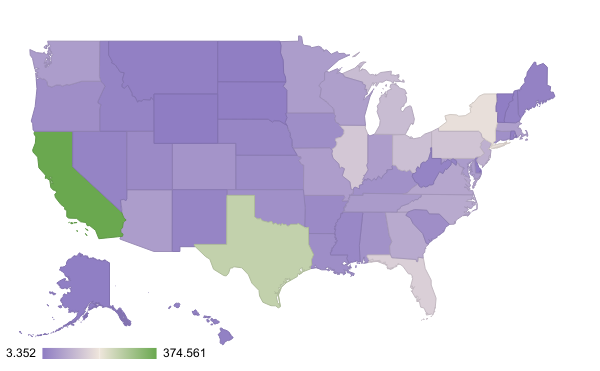
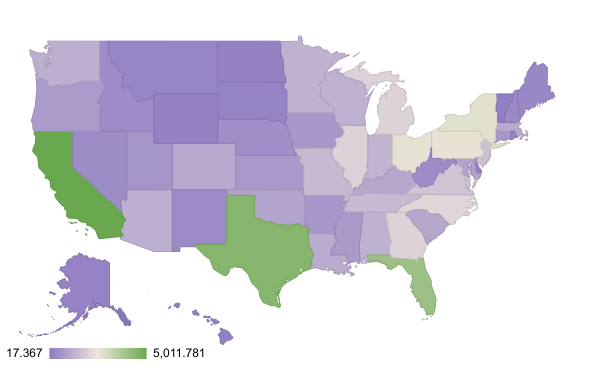
The data on this page is a statistical analysis of all registered Democrat and Republican voters vs. how many people graduated high school in 2008. All data for population is in thousands.
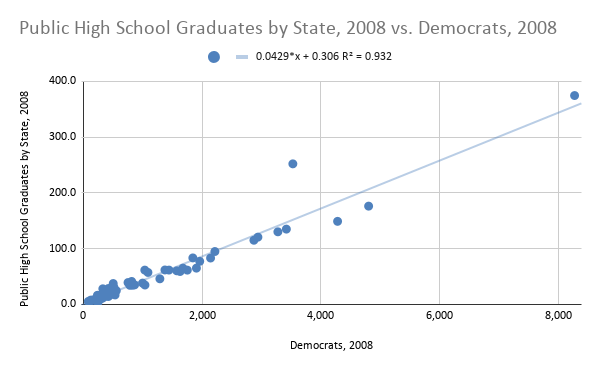
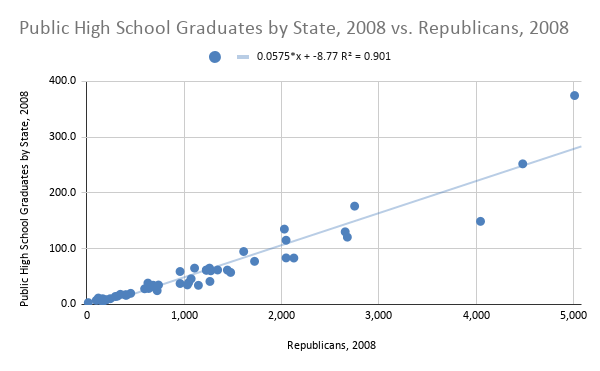
Most states have a pretty even split between Democrats and Republicans that live in the states. Both states additionally have a considerable amount of high school graduation amounts, with Democrats having a slightly more correlated number of 0.932. I expected to see Republicans have a much lower number, but it appears to not be the case.